As lead web user experience designer at USGS for more ten years, I have been the lead of the USGS Office of Communications S.M.A.R.T. Analytics Metrics Program responsible the strategic development, execution, and delivery of enterprise-wide analytics to include the performance data collection, reporting, and training. The program's goal is to provide data and feedback to leadership, decision-makers, and USGS staff and content managers at large about the effectiveness of product types, communication strategies, and techniques to validate or enhance website content strategies, data applications, and marketing efforts.
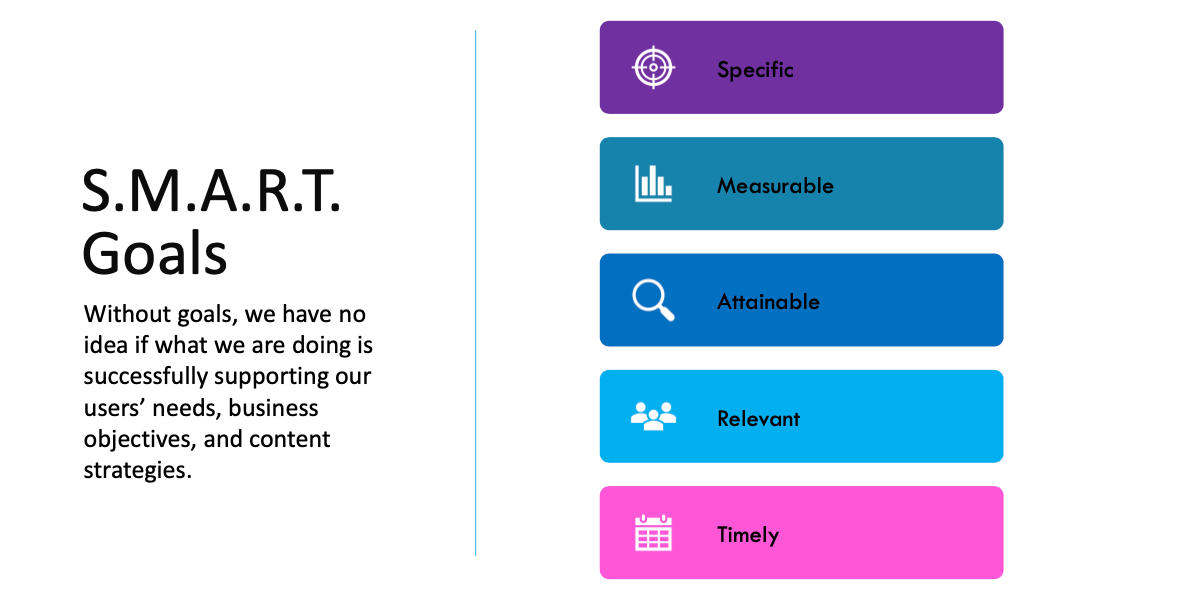
Yearly, I update and enhance our master S.M.A.R.T. Analytics Plan with key performance indicators (KPIs), targets, dimensions using various tools and dashboards for leadership and stakeholders to make data-driven decisions. Recommending and developing new tracking methods because of gaps in data, target adjustments, or other management needs is another responsibility that occurs throughout our reporting cycles. The USGS S.M.A.R.T. Analytics Plan is derived from understanding, defining, measuring, and analyzing data as they relate to the web business objectives.
I'm also responsible for the execution, data collection and reporting of our Customer Satisfaction Data and Feedback which we have through a third party vendor CFI Group. This is the pop-up questionnaire that allows our public audience on usgs.gov to answer questions and provide comments regarding different aspects of the website. Monthly and yearly communications and training are conducted with website owners and senior leadership.
A major tool of capturing the usgs.gov user interactions is Google Analytics. I have created multiple Google Analytics LookerStudio Dashboards for various internal audiences to access data to easily understand whether we are supporting our users' needs, business objectives, and content strategies.
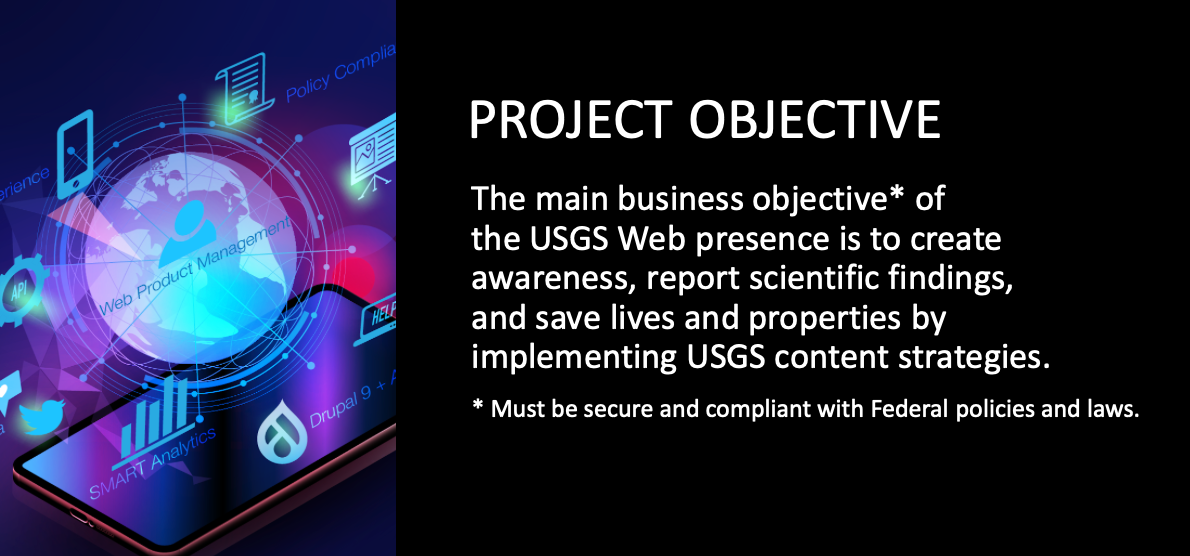
Analytics Tools
Below are the tools used to implement S.M.A.R.T. Analytics Plan and follow the analytics lifecycle.
Customer Satisfaction
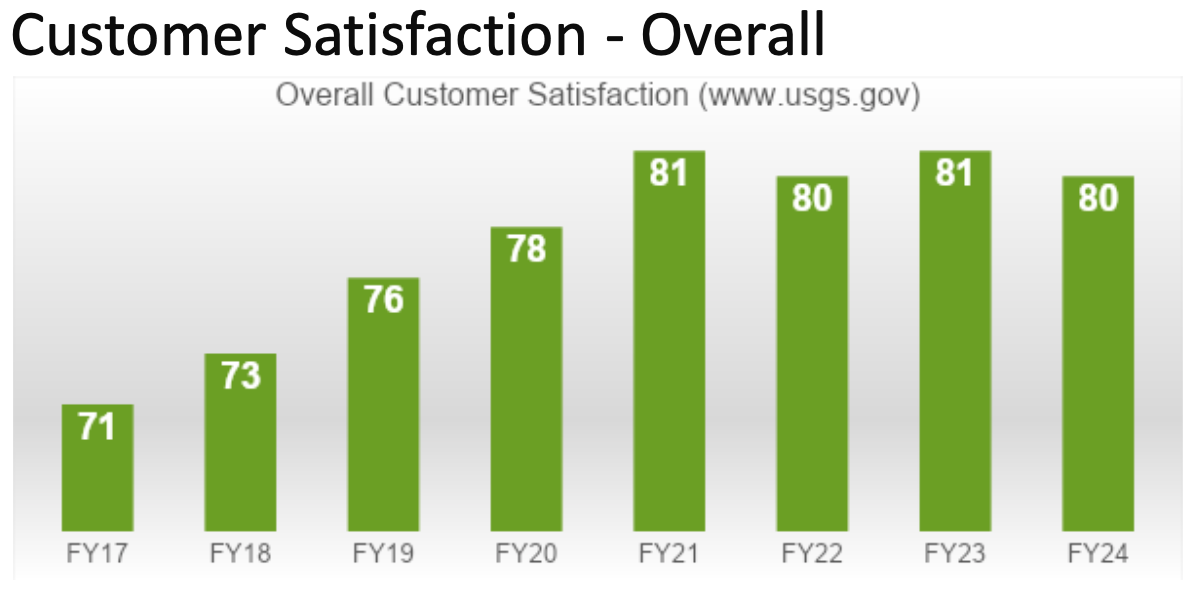
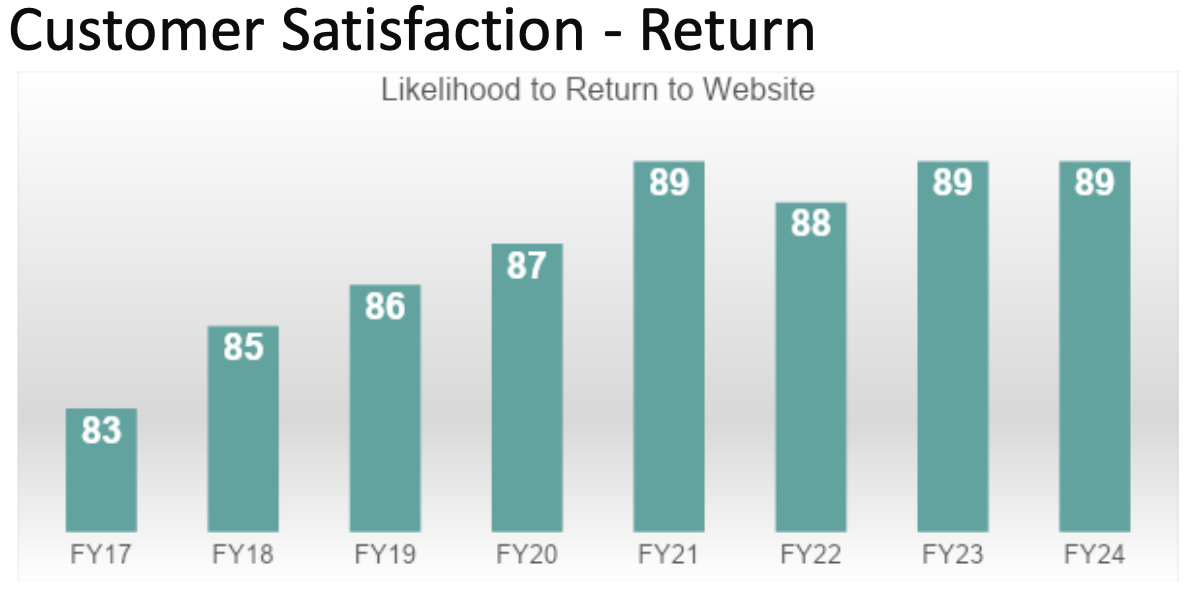
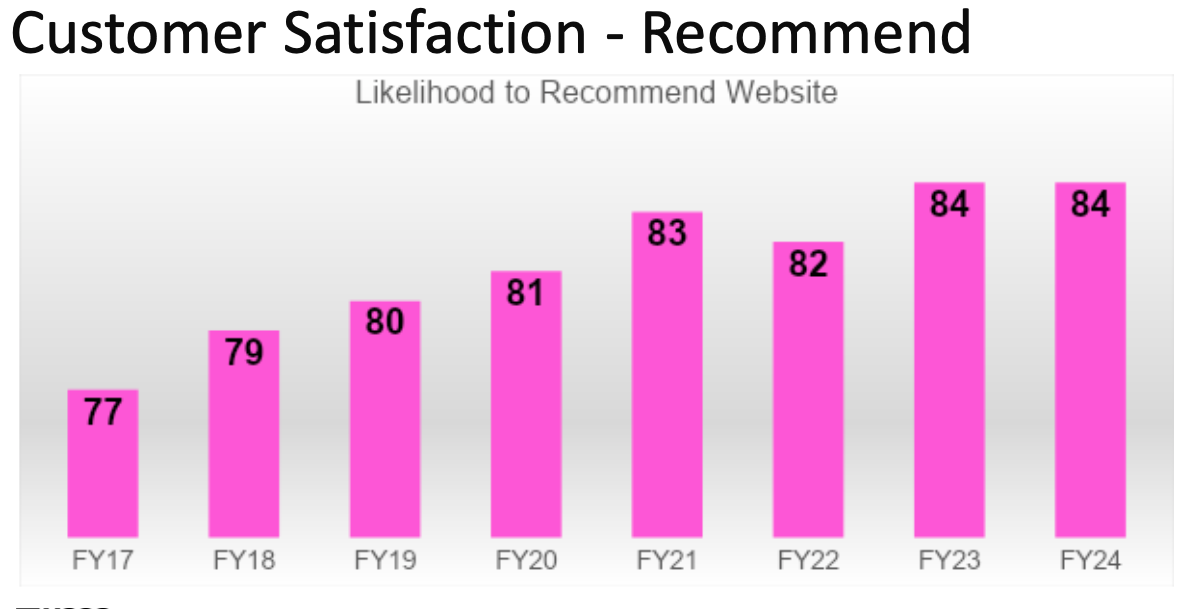
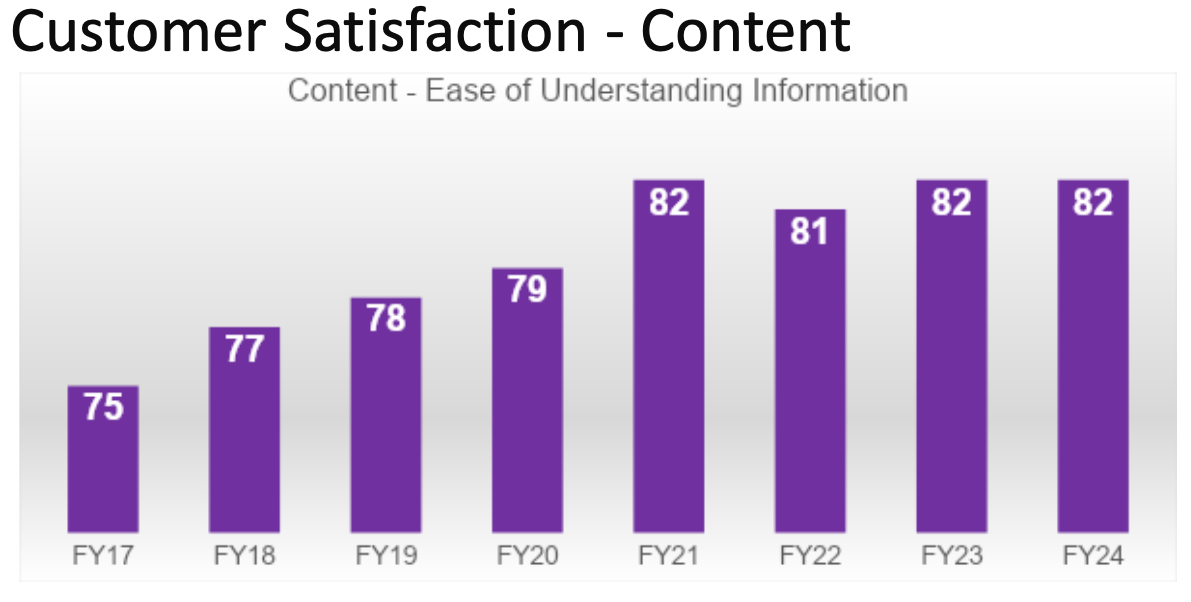
The USGS web presence, our flagship usgs.gov is delivering science and data information and is highly rated by the public. The chart below demonstrates USGS compared Government website trends of citizen experience. The American Customer Satisfaction Index, ACSI, is a national cross-industry measure of customer satisfaction in the United States. (FY24 Government-wide ACSI score not available at time of presentation). Also usgs.gov has performed well since the migration into one consistent Drupal website experience back in April of 2016. See customer satisfaction data trends of overall customer satisfaction, likelihood to return to website, likelihood to recommend, and ease of understanding content. This data is a measurement of success and validates the USGS goals and content strategies.
Google Analytics LookerStudio Dashboards
Easily accessible dashboards, hosting monthly trainings with stakeholders, and providing yearly annual reports was one of my major initiatives to help all levels of management to track and/or enhance content strategies using specific metrics for the following areas:
1. Customer Satisfaction
2. Brand Advocacy (Branding)
3. Areas of Science (Branding)
4. Usability (Users achieving top tasks)
5. Usability (Mobile and desktop)
6. Top Channels
7. Search (Organic and site search)
8. Readability
9. Section 508
10. Strategic Campaigns
11. 404 Errors (Users not achieving top tasks)